Monday, 30 November 2015

Compare last row results in OBIEE

Frequently User ask to compare last row results. If the dimension column is either Date,Week,Month,Qtr or Year then we can go with Time series Functions to compare the results.

But the dimension column is not an period and the requirement is to compare results between Offices or LOBs then  Time series functions are helpless.

In that case we can use LAG function.

User requirement
---------------------
Office wise Order details are as follows,

Office Key || Office ||    No.Orders
===========================

1                 || ABC  ||    100
2                 || XYZ  ||    200
3                 || MNO ||    150

User want to compare Orders by Office.

Office Key || Office ||    No.Orders || Last Row Orders || Diff
=============================================

1                 || ABC  ||    100            || 0                            || 100 
2                 || XYZ  ||    200            || 100                        || 100 
3                 || MNO ||    150            || 200                        || -50

Solution
-------------------


LAG function is not OBIEE function, so we can perform this using Evaluate function.
EVALUATE('LAG(%1,1)over(order by CAST(%2 AS INT))',"Calculated Facts"."# of Orders","More Office Objects"."Office Key")

Here we are comparing Number of Orders by last row results by office Key.

LAG(%1,1)over(order by CAST(%2 AS INT))

Where %1 is , Measure i.e No Of Orders
           1 is,  last row (if we give 2 then comparing current row and 2nd row result from current row)
            %2 is, Office Key


Where "Diff" is (# of Orders) - (Previous # of Orders).

If Time series functions are not created then we can use  LAG function.

Friday, 6 March 2015

Contert "Date" datatype Varchar to Date


CAST(EVALUATE('TO_CHAR(TO_DATE(%1,%2),%3)',<<Date Column>>,'MM/DD/YYYY','DD/MON/YYYY') AS DATE)  


Wednesday, 15 January 2014

OBIEE 11g - Single Apply Button

Steps to follow :
1.Don't hide "Apply" button from the dashboard.
    If you hide "Apply" button, values pass automatically from prompts to reports.
2.Hide "Reset" button from the dashboard.

Hide & Stop passing the values until click on the "Apply" button. For that follow the code

<style type="text/css">.PromptViewCell .button{display:none}</style>

For Single "Apply" button and the  functionality as follows,

<DIV CLASS = "XUIPromptEntry minibuttonOn">
<input class="button" type = "button" value = "Apply" onclick='javascript:

try


var aElm=PromptManager.getPromptManager().getAllPromptCollectionJSON();

   for(var i = 0; i < aElm.length; i ++ )

  {

   {


     for(var j = 0; j < aElm[i].promptSteps[0].prompts.length;      j ++ )


     {


 var promptid =    aElm[i].promptSteps[0].prompts[j].promptStreamID   ;

      var g = null;
      var h = PromptManager.getPromptManager().getPromptCollectionInfoWithViewID(aElm[i].viewStatePath);

        if(h)

       {
          try
{
 var b = h.getAllPromptExprsArray();
 if( ! h.verifyPromptValuesAndDisplayError(b))
{
  return
    }
          g = PromptManager.buildPromptExprGivenExpr(" ", b)
         }
         catch(f)
         {
           alert(f);
           return
    }
        }

       PromptManager.submitPrompt(aElm[i].viewStatePath, true, "PromptFinish", g)

     }

    }

  }
}

catch(e) {alert("Apply ALL Button Exception " + e.description);}'></input>

<input class="button" type = "button"  value = "Reset" ONCLICK = 'return PersonalizationEditor.removeDefaultSelection(false)' > </input>
</DIV>

"Apply" button settings


"Reset" Button Settings


I am having 2 different set of prompts
1st Prompt  contains period information (Year & Month)

Save as Test1 


2nd Prompt contains Office & Product information

Save as Test2

Report is as follows

Save as Test1

Hide & Stop Apply button functionality
Place the Blue in color code  in the Text box (in this example: Text1)


"Apply" & "Reset" button code and functionality
Place the Red in color code in the another Text box (in this example : Text2)


Dashboard layout 


Dashboard at Finally

Clicks on "Apply" button


Clicks on "Reset" button


Note : While copy & paste the codes beware of double quotes (" ). If double quotes are not proper in copying adjust and then paste.

Thursday, 5 December 2013

Usage Tracking in OBIEE 11g

Why Usage Tracking
   It tracks the usage of the Reports and Dashboards. We will get to know the usage tracking while clicking on Manage Sessions. But using that data we can’t build the statistics. We can achieve by using Usage Tracking feature. It collects data for each query and inserts into the database table, So that we can build our analysis reports based on the data. We can do analysis like,

How many users are logged in a particular period
Which query takes long time to execute
Reports runs from which Subject Area
What is the record count in a report
      etc..
Implementation
Check for the table, S_NQ_ACCT table in DEV_BIPLATFORM (In this example DEV3_BIPLATFORM)
DEV_BIPLATFORM should contains write access
Import S_NQ_ACCT table into Repository Physical Layer
Create  logical tables (In this example : 1 fact and 3 Dimensions) by using the same Physical table       (S_NQ_ACCT) and create logical join between these tables
Create Usage Tracking Subject Area
Configuring Usage Tracking in em (Enterprise Manager)
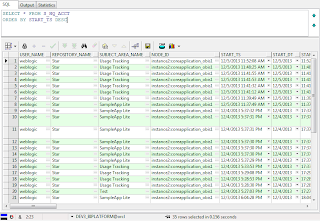
Check whether Manage Session data and Usage Tracking Subject Area data same or not

Picture speaks a thousand words...


Tuesday, 26 November 2013

DENSE_RANK as a filter in OBIEE


  When we are using other than OBIEE function in a filter, we  will be getting an error saying that, "ora-30483 window functions are not allowed here at OCI call" .

Here is the solution for DENSE_RANK in a filter.

RANK is the OBIEE funtion, so that we can use RANK in filter condition.
Criteria :

Result :

Query : Physical query for the above report from Mangae sessions as below

DENSE_RANK is not an OBIEE function, so that we use EVALUATE function.

Criteria : Get Rank1 & 2 results using DENSE_RANK
Result : 


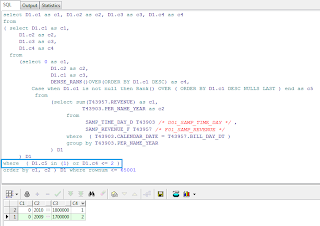
Query : Physical query for the above report from Mangae sessions as below. Query also throws same error as Results, getting in OBIEE.

Solution : From the 1st criteria, we will get Rank 1 result. We want Rank 1 & 2. It is from 2nd criteria.
If we get the query same as 1st Query (RANK function physical query), then we can apply DENSE_RANK in a filter i.e DENSE_RANK filter should come as inner query but not in Having condition.

Apply both RANK and DENSE_RANK in a filter with "OR" operation. Issue resolved.


After applying both the filters with "OR" operation, then we can see the query same as RANK function.

Logic behind : When User want to see the TOPN results, there is no chance to enter 0 (Zero) . He should enter 1 or more than that. As we use RANK with "OR" operation, even though user enters 1 then RANK and DENSE_RANK gives the same result. 

Tuesday, 12 November 2013

Import data from EXCEL to Oracle table using PL/SQL Developer

After long time I am writing this article.

Here I am explain how we can import EXCEL data into Oracle table by using PL/SQL developer.
Here is the sample EXCEL sheet.


Now create a table with the columns, "EID","ENAME" and "Salary" in the database as below.

Choose "ODBC Importer" from Tools Menu. 


Select "Excel Files" from the drop down and click on "Connect". Now choose the Excel file and click "ok".


Note : Drives can be choose from the drop down as marked in the above image

Listed the all sheets in selected Excel file. Choose the sheet which having data. We can see preview of the data from "Result Preview".


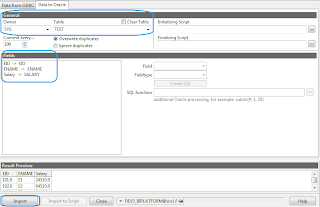
Click on "Data to Oracle" tab and select "Owner" , "Table" from drop down.


In this case I created table "Test" under "SYS" owner. After selecting the table fields will be mapped automatically, because we created the columns withe same name of the excel columns. Check the preview and click on "Import".

Now Excel data transfer into Oracle table, "TEST".


Monday, 1 August 2011

Is prompted Vs Presntation variable and Protect Filter


Both “Is prompted” and Presentation variable will do the same work, i.e Pass value from prompt to report. But there is a slight difference in between. Let me discuss on the same.. 

Isprompted
Create a prompt using “Employee.ename”.
 
Create a report with "Office.oname"(Office Name),  "Employee.ename"(Employee Name),"Employee.salary" (Salary) as a columns.Add filter
where Employee Name taken from "Employee.ename".

 
Get the prompt and report into dashboard. Now change ename to ‘E1/kumar’, then the report filter out according to ‘E1/kumar’.


Let the columns in the report remains same, we will change the filter condition now. Let us take “Office.ename” is prompted.

 
Now you can observe that, if you change ename to ‘E1/Kumar’ then also the report is not filtering according to passed values.

 
Reason: If the prompt column and the column, which used in the filter (for a report) are taken from the same table, then Is prompted will work.
Presentation variable
Create a presentation variable called name for the column “Employee.ename”.
 
  Now, in the report change the filter "Employee.ename" to "Office.ename" and use presentation variable.


Login as ‘kumar’. By default prompt shows ‘kumar’,because we used session variable as default value. If you change ename as ‘kumar/E1’ then the report is filtered according to value passed.


Protect Filter
Use session variable in the report filter.

  Login as ‘kumar’, by default prompt value is ‘kumar’, because we used session variable as a default value. If you change the ename to ‘E1’ then the report also filters out according ‘E1’. But user is not expected that.
 
Now give protection to the filter i.e apply ‘Protect Filter’.

 
Now login as ‘kumar. If you chage ename to ‘E1’also the report won’t be filtered out according to the value ('E1') passed.

Reason: Protect Filter will not allow override, hence by default only the value which is defined in the filter of the report will be passed as a value and hence you can see only "kumar’s" data is showing above, even if you change prompt to "E1"still "kumar’s" data is showing up in the report.